
Установка и запуск на Ubuntu / Debian
Установка
Добавляем репозиторий командой:
add-apt-repository «deb https://packages.grafana.com/oss/deb stable main»
Устанавливаем ключ для проверки подлинности репозитория графаны:
wget -q -O — https://packages.grafana.com/gpg.key | apt-key add —
Обновляем список портов:
apt-get update
Выполняем установку:
apt-get install grafana
… и отвечаем Y на запрос.
Настройка брандмауэра
По умолчанию, в Ubuntu брандмауэр не блокирует соединения. Но если в нашей системе он используется, необходимо добавить порт одной из команд:
а) при использовании iptables:
iptables -A INPUT -p tcp —dport 3000 -j ACCEPT
netfilter-persistent save
* если при вводе второй команды система выдаст ошибку, устанавливаем необходимый пакет командой apt-get install iptables-persistent.
б) при использовании ufw:
ufw allow 3000/tcp
ufw reload
предисловие
Цель настройки мониторинга сервера Linux состоит в том, чтобы иметь сервер Alibaba Cloud с 2 г. памяти. Открытие большего количества программного обеспечения приведет к очень высокой загрузке памяти и ЦП и, в конечном итоге, к зависанию сервера.
Исходя из этого, я хочу знать, каков текущий процессор и память. Консоль Alibaba Cloud ECS также обеспечивает мониторинг серверов, но для изучения системы мониторинга серверов Linux все еще планируется создать набор.
Конечно, существует множество систем мониторинга Linux-серверов, а Zabbix — это решение с открытым исходным кодом на уровне предприятия, которое обеспечивает мониторинг распределенной системы и сети на основе веб-интерфейса.
Поэтому на основе Zabbix + Grafana для построения системы мониторинга сервера.
Открываем и настраиваем портал
Проверяем работу портала
После установки графаны открываем браузер и переходим по адресу http:// :3000.
Для авторизации используем логин и пароль: admin / admin.
Система может потребовать задать новый пароль — вводим его дважды.
Добавляем плагин для работы с Zabbix
Установка плагина для подключения к Zabbix выполняется командой:
grafana-cli plugins install alexanderzobnin-zabbix-app
После окончания установки мы должны увидеть:
Installed alexanderzobnin-zabbix-app successfully
Перезагружаем сервер графаны:
systemctl restart grafana-server
Переходим к веб-интерфейсу и открываем управление плагинами:
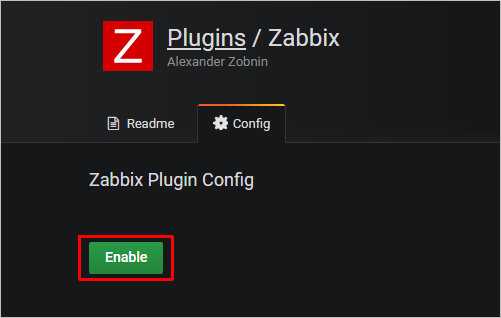
В открывшемся списке находим Zabbix и переходим к нему:
Активируем его, кликнув по Enable:
Добавляем источник данных
Переходим в раздел Configuration — Data Sources:
Кликаем по Add data source:

Выбираем Zabbix в качестве источника данных:

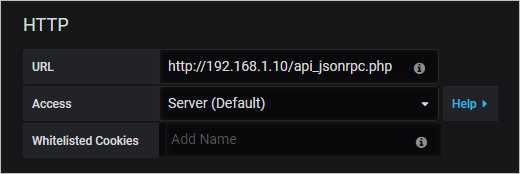
На открывшейся странице в разделе «HTTP», поле URL вводим http:// /api_jsonrpc.php, например:
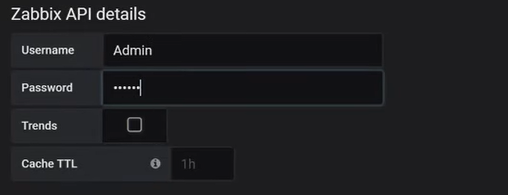
Ниже, в разделе «Zabbix API details», вводим логин и пароль для учетной записи с правами выполнения запросов API, а также выбираем версию нашего сервера Zabbix:
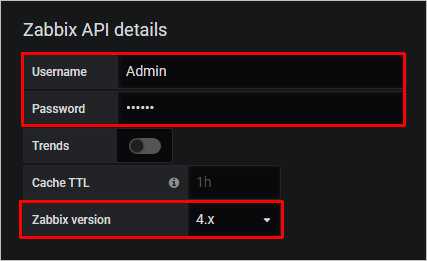
* по умолчанию, в Zabbix создается учетная запись с правами администратора Admin с паролем zabbix. Однако, эту запись лучше использовать для проверки, а для целей интеграции лучше создать нового пользователя.
Нажимаем на Save & Test. Готово.
Создаем график на основе метрики в Zabbix
Переходим в раздел Create — Dashboard:
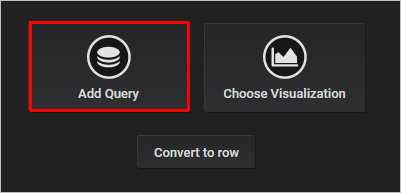
Выбираем Add Query:
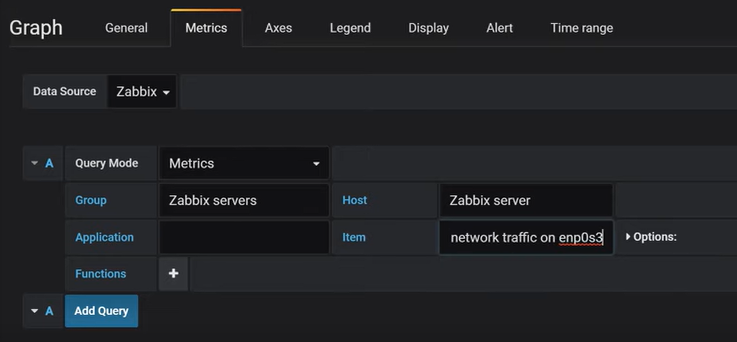
Заполняем поля для получения данных с Zabbix:
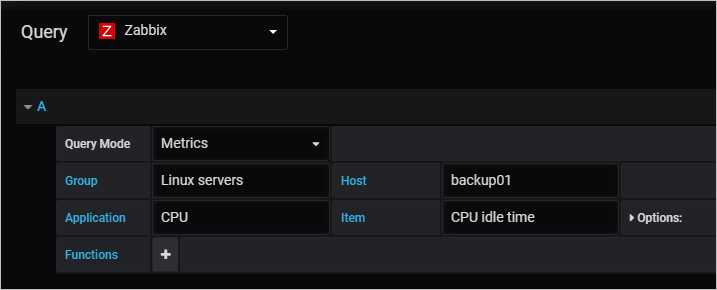
- Query — источник данных. Выбираем Zabbix.
- Query Mode — тип данных. Оставляем Metrics.
- Group — группа серверов в Zabbix. Выбираем нужную нам группу.
- Host — имя сервера, для которого будем вытаскивать данные.
- Application — данные для какого компонента будем собирать. В данном примере, процессора.
- Item — какой именно тип информации нас интересует. На скриншоте выше выбрано время простоя процессора.
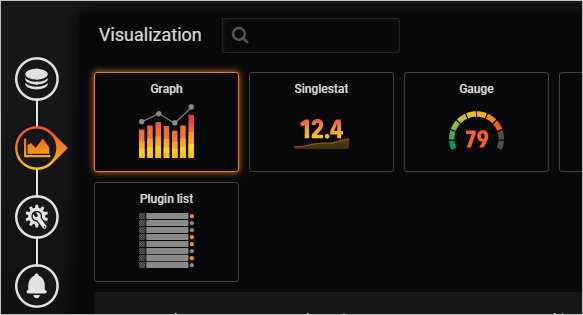
При желании, можно настроить графики в разделе Visualization:
В открывшемся всплывающем окне задаем имя дашборду и нажимаем Save. Готово.
источник
Anatomy of a plugin
Plugins come in different shapes and sizes. Before we dive deeper, let’s look at some of the properties that are shared by all of them.
Every plugin you create will require at least two files: and .
plugin.json
When Grafana starts, it scans the plugin directory for any subdirectory that contains a file. The file contains information about your plugin, and tells Grafana about what capabilities and dependencies your plugin needs.
While certain plugin types can have specific configuration options, let’s look at the mandatory ones:
- tells Grafana what type of plugin to expect. Grafana supports three types of plugins: , , and .
- is what users will see in the list of plugins. If you’re creating a data source, this is typically the name of the database it connects to, such as Prometheus, PostgreSQL, or Stackdriver.
- uniquely identifies your plugin, and should start with your Grafana username, to avoid clashing with other plugins. Sign up for a Grafana account to claim your username.
To see all the available configuration settings for the , refer to the plugin.json Schema.
module.ts
After discovering your plugin, Grafana loads the file, the entrypoint for your plugin. exposes the implementation of your plugin, which depends on the type of plugin you’re building.
Specifically, needs to expose an object that extends , and can be any of the following:
Grafana-way. Используем стек значений
InfluxDBGrafanaGrafana
2.1. Просто сделаем Hover tooltip / Stacked value: cummulative
TypenameTypeGrafana
- Add series override / HEAP / Stack: A
- Add series override / NON_HEAP / Stack: B
- Stacking & Null value / Stack: On
- Hover tooltip / Stacked value: cummulative
- Hover tooltip / Mode: Single
Grafana
- если разделить метрики на Stack A и B уже после активации Stacking & Null value / Stack: On, то метрики не разделятся;
- если оставить Hover tooltip / Mode со значением по умолчанию, не перевести в Single, то Hover tooltip не будет отображаться вообще.
NON_HEAPNON_HEAPGrafanaHEAPHEAPHEAP
2.2. Stacked value: cummulative со скрытием промежуточных линий
- Добавим в результаты новые метрики с другим именем и значением 0.
- Новые метрики добавим в Stack A и Stack B, на вершину стека.
- Скроем из отображения — оригинальные линии HEAP и NON_HEAP.
BC«Usage.committed»first(«Usage.committed»)-first(«Usage.committed»)HEAPStack AHEAPNON_HEAPStack BNON_HEAPGrafanaНенормальное программирование
Transform
groupBy
Takes each timeseries and consolidate its points fallen in the given interval into one point using function, which can be one of: avg, min, max, median.
Examples:
Takes timeseries and multiplies each point by the given factor.
Examples:
delta
Converts absolute values to delta. This function just calculate difference between values. For the per-second
calculation use .
rate
Calculates the per-second rate of increase of the time series. Resistant to counter reset. Suitable for converting of
growing counters into the per-sercond rate.
Graphs the moving average of a metric over a fixed number of past points, specified by param.
Examples:
Takes a series of values and a window size and produces an exponential moving average utilizing the following formula:
The Constant is calculated as:
If windowSize < 1 (0.1, for instance), Constant wouldn’t be calculated and will be taken directly from windowSize
(Constant = windowSize).
It’s a bit tricky to graph EMA from the first point of series (not from Nth = windowSize). In order to do it,
plugin should fetch previous N points first and calculate simple moving average for it. To avoid it, plugin uses this
hack: assume, previous N points have the same average values as first N (windowSize). So you should keep this fact
in mind and don’t rely on first N points interval.
Examples:
percentile
Takes a series of values and a window size and consolidate all its points fallen in the given interval into one point by Nth percentile.
Examples:
Replaces series values with if value > N
Examples:
Справочная статья:
-
Zabbix официальная документацияhttps://www.zabbix.com/documentation/3.4/zh/manual/quickstart/login
-
Docker боевой два: Zabbix монитор других машинhttps://blog.csdn.net/bbwangj/article/details/80786623
-
Развертывание докера ELK, графана, zabbixhttps://blog.51cto.com/zhanghy/2300633
-
Grafana + Zabbix — развернуть распределенную систему мониторингаhttps://www.cnblogs.com/yyhh/p/4792830.html#l02
-
Докер запускает графаны в сочетании с zabbixhttps://cloud.tencent.com/info/6969106dee9ecb7eaca02744c94a0614.html
-
Zabbix сервер + агент + платформа мониторинга производительности сборки проксиhttps://blog.csdn.net/zha6476003/article/details/80562860
-
Графана плагинhttps://grafana.com/plugins/alexanderzobnin-zabbix-app/installation
-
Графана шаблонhttps://grafana.com/dashboards?category=zabbix
(end)
Рекомендуемое исследование
Рекомендую Хогвартс Тест Академию«Тестирование разработки от входа до продвинутого боя»Курс помог многим отличникам успешно повысить свой уровень мастерстваЗнаменитые предприятияВысокооплачиваемое предложение,В настоящее времяРегистрация на девятый этап ограничена по времени.
Школа тестирования Хогвартса«Тестирование разработки от входа до продвинутого боя»Система курсов серии разработана в соответствии со стеком технологий тестирования и разработки первоклассных интернет-компаний, таких как Ali, Tencent, Baidu и т. Д., И преподается рядом технических экспертов в сообществе TesterHome, первоклассных старших архитекторов тестирования и менеджеров тестирования, охватывающих текущиеСамый популярныйТехнология тестирования мобильной автоматизации, технология веб-автоматизации, интерфейсный тест, тест производительности, тест безопасности, специальный мобильный тест, непрерывная интеграция и DevOps, аудит и анализ кода, построение системы контроля качестваИ т.п.
«Тестирование разработки от входа до продвинутого боя»Курс также является поисковым рейтингом курса по тестированию и разработке программного обеспечения на официальном сайте Tencent Classroom.NO.1Классический курс, по20+Старший менеджер тестов и архитектор тестов ведущих интернет-компаний3Это было отполировано и обновлено в прошлом году и было выращено300Многие разработчики тестов, курс похвалы100%。
Возле100Ведущие интернет-производители, такие как Али, Baidu, Tencent, Huawei, Toutiao, Meituan, Xiaomi, OPPO и др.Тест менеджерВсе они в течение длительного времени набирают отличные таланты для разработки тестов в Академии тестирования в Хогвартсе, и колледж также немедленно синхронизирует информацию о предложениях известных предприятий и регулярно организуетИнтерполяциядеятельность.
В настоящее времядевятыйОграниченное по времени предложение на горячую регистрацию в классеТестовые студенты, которые хотят систематически улучшать техническую мощь, могут следить за «маленьким помощником» WeChat и отвечать »девятыйВойдите в консультационную группу, чтобы узнать больше о преференциальной информации. Ссылка на курс:https://ke.qq.com/course/254956
Conclusion
As you can see, the Grafana possibilities are pretty huge. You can also download plugins, additional panels, etc. from the official Grafana Labs.
Pretty much everything inside Grafana can be edited. Visualization can be customized, which lets you create beautiful graphs. You can also add new users and restrict permissions.
Note. When specifying a user name for a data source, remember that permissions assigned in the front end also apply to the API. In my case, it is superadmin that can see everything and gather all the values from Zabbix.
So that’s about it. You now know how to install and configure Grafana. I’ll see you later, stay tuned.
Ссылки (вместо списка литературы)
- grafana (6.5.0)
- influxdb (1.7.9)
- telegraf (1.13.3)
- jolokia-jvm-1.6.2-agent.jar (1.6.2)
| Сущность | Описание |
|---|---|
| Retention policy, InfluxDB Data Retention | Retention policy montn длиной в 30 дней использую, чтобы хранить метрики производительности JVM и другие оперативные метрики. Обычно политикой по умолчанию является политика auto, которая не имеет максимальной длительности. Используется в «Как всё начиналось» в содержимом telegraf.conf и в текстах запросов к InfluxDB всех разделов, и на снимках конструкторов запросов Grafana |
| Telegraf / InfluxDB v1.x Output Plugin | Настройка отправки метрик из Telegraf в InfluxDB. Используется в в содержимом telegraf.conf |
| Telegraf / | В статье описан случай, когда метрики собираются каждые 2 секунды. Используется в «Как всё начиналось» в содержимом telegraf.conf. И в «1.2. Сумма с группировкой по тегу за минуту» и «1.3. Сумма с группировкой по тегу за секунду» |
| Java 8 / Interface MemoryPoolMXBean | Описание интерфейса MemoryPool, где видно, что все поля либо bool, либо long. Поэтому все метрики в telegraf.conf приводятся в типу int |
| Telegraf / Jolokia2 Input Plugins | Используется в telegraf.conf для выбора MBean-полей, которые будут сохраняться в InfluxDB |
| Telegraf / Converter Processor | Используется в telegraf.conf, чтобы сконвертировать метрики из типа float в тип int перед сохранением в InfluxDB. И чтобы сконвертировать строковое поле Type в тег Type, именно по нему и выполняется группировка в статье |
| Grafana / Variables / | Переменные Grafana, для которых настроен Multiselect не нуждаются в экранировании, а остальным необходимо экранирование, если они используются в фильтрах, как регулярные выражения — недостаточно, нужно |
| Grafana / Variables / Global Built-in Variables / | Описание Grafana-макроподстановки $timeFilter, которая используется во всех запросах |
| InfluxDB / | Описание селектора MAX() из InfluxDB 1.7, который используется для выбора максимального значения поля |
| InfluxDB / | Описание функции аггрегирующей функции SUM() из InfluxDB 1.7 |
| InfluxDB / | Описание механизма подзапросов в InfluxDB 1.7, который используется в разделе 3 статьи |
| InfluxDB / Transformation / | Описание трансформации CUMULATIVE_SUM(), которая часто пригождается при написании запросов к InfluxDB, в всязке с NON_NEGATIVE_DERIVATIVE() |
| InfluxDB / Transformation / | Описание трансформации NON_NEGATIVE_DERIVATIVE(), которая использовалась в разделе 3 статьи. И которая компенсирует эффект CUMULATIVE_SUM() — мы получили нулевой эффект от их связки в разделе 3 |
| Using Grafana’s Query Inspector to troubleshoot issues | Описание Query Inspector, которое используется в статье для просмотра количества возвращаемых значений, для просмотра финального запроса со всеми подстановками Grafana-переменных |
| Grafana / Graph / | Описание настроек Stack, Tooltip,… которые использовались для отображения суммарного значения во всплывающих подсказках к графикам в разделе «2. Grafana-way. Используем стек значений» статьи |
| Grafana / Graph / | Описание возможности переопределить настройки отображения серий значений (отдельной линии графика или группы линий) в Grafana |
[4.0.0] — 2020-08-25
4.0 Feature highlights
Grafana-Zabbix 4.0 comes with a bunch of changes under the hood. The most important thing introduced is a backend, which brings a number of benefits:
- Alerting support (limited, data processing functions are not supported yet).
- Fixed security issues related to exposing data source credentials to the Grafana frontend and storing password as a plain text in database.
- Improved performance (plugin can cache queries and process data on the backend).
- With improved security it makes easier to add actions (execute scripts, close problems, etc).
Installation
Prerequisites: plugin requires Grafana 7.0 to run.
Use the grafana-cli tool to install Zabbix from the commandline:
-
Unsigned plugins are not loading by default, so allow it in the Grafana config file:
- restart Grafana server
Refer to option description for more information.
Added
- Alerting support (limited, data processing functions are not supported yet), #801
- Problems: execute scripts, #978
- Problems: tooltip with problem description
- Problems: use severity filter from panel options
Fixed
- Problems: problems history
- Problems: sorting by severity, #921
- Datasource: reconnecting on request error
- Problems: filtering by tags
- Problems: sorting order
- Problems: performance improvements (remove unnecessary queries)
- Problems: empty problem list, #955
- Problems: panel migrations when panel options is not opened (options not saved after reload)
- Problems: item value tooltip placement
Step 3 — Configuring the Zabbix Plugin
Log in to the Grafana web interface by navigating to the address .
Note: Grafana listens for incoming connections on port . If you have a firewall configured, you’ll need to open this port. Review this tutorial to learn about the firewall in CentOS if you run into issues.
The default login credentials are . You can change your password on the Profile page once you log in. When you log in, you’ll be greeted by the Home dashboard.
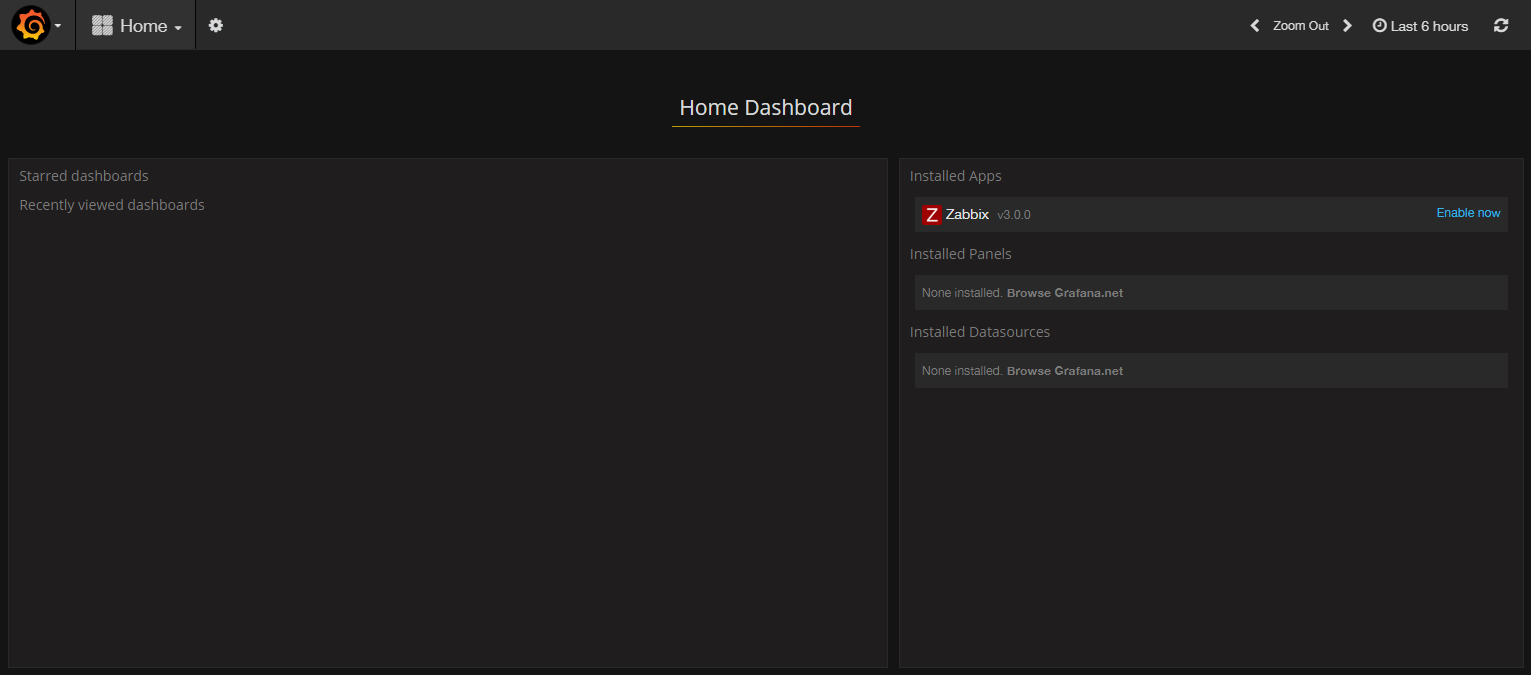
Access Grafana’s main menu by clicking on the Grafana logo in the top left corner of the user interface. Then select Plugins. Then select the Apps tab. Then click on the Zabbix app and enable it by pressing the Enable button.
Now you can add a new data source. Select the Grafana logo again and navigate to Data sources. Then click the Add data source button. You will see the configuration page for the data source:
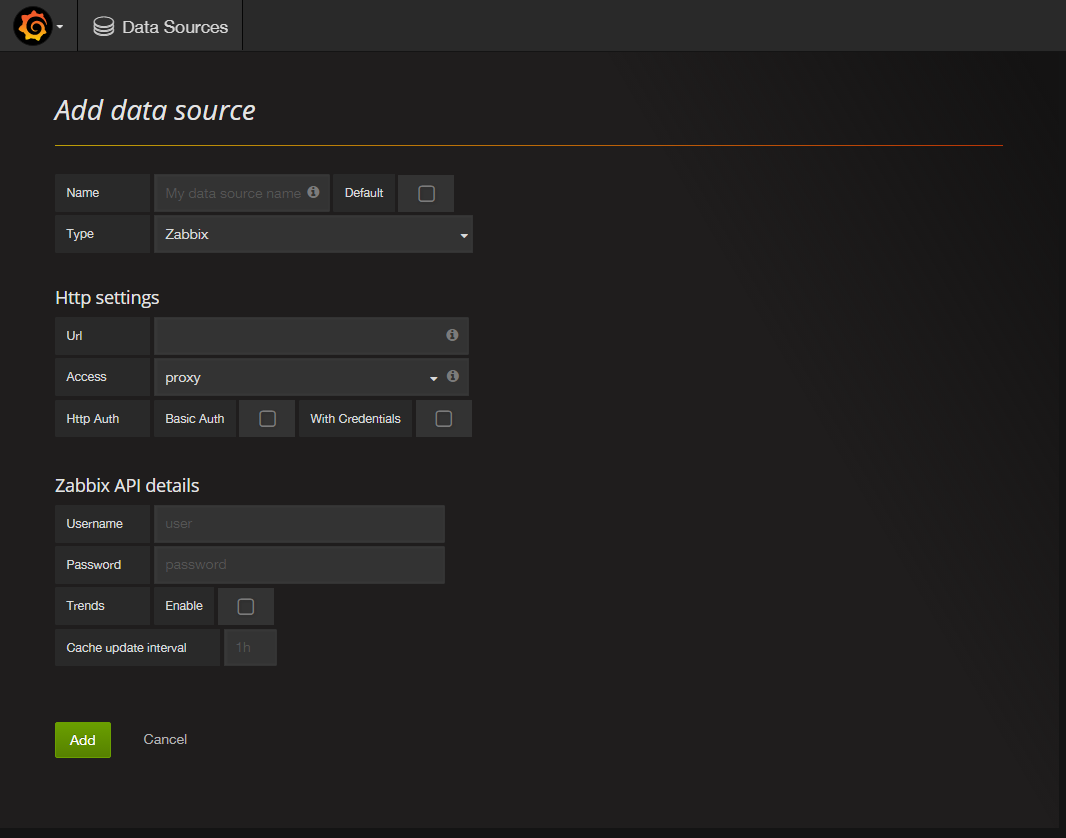
Configure the data source as follows:
- Enter a name for this new data source in the Name field.
- Check the Default option so this data source will be preselected in new panels you create.
- Select Zabbix from the Type drop down list.
- Fill in the Url field with the full path to the Zabbix API, which will be .
- Fill in the Username and Password fields with the username and password for Zabbix. The default username is and the default password is .
- Enable the Trends option; it will increase Grafana’s performance when displaying long time periods.
You can leave the other options at their default values.
Click the Add button to test and save the configuration. You’ll see a success message that looks like the following:
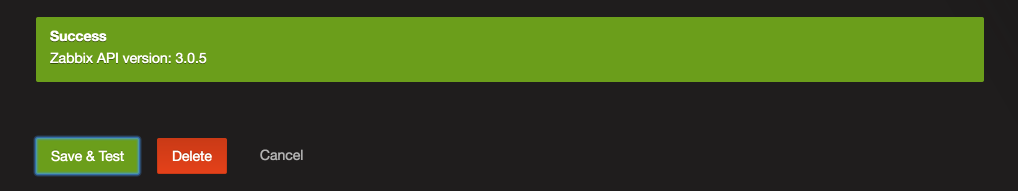
If you do not see this message, check your credentials and test again.
Now let’s look at the Zabbix dashboard that came with the plugin. Select Zabbix server Dashboard from the dropdown list at the top of the screen. When you select it, the dashboard displays information about your Zabbix server:
This dashboard is pretty informative, but you can create your own custom dashboard from scratch.
Alias
Following template variables available for using in and functions:
- , — item name
- — item key
- — visible name of the host
- — technical name of the host
Examples:
Returns given alias instead of the metric name.
Examples:
Returns part of the metric name matched by regex.
Examples:
replaceAlias
Replace metric name using pattern. Pattern is regex or regular string. If regex is used, following special replacement patterns are supported:
| Pattern | Inserts |
|---|---|
| $$ | Inserts a «$». |
| $& | Inserts the matched substring. |
| $` | Inserts the portion of the string that precedes the matched substring. |
| $’ | Inserts the portion of the string that follows the matched substring. |
| $n | Where n is a non-negative integer less than 100, inserts the nth parenthesized submatch string, provided the first argument was a RegExp object. |
For more details see String.prototype.replace() function.
Examples:
Create a new plugin
Tooling for modern web development can be tricky to wrap your head around. While you certainly can write your own webpack configuration, for this guide, you’ll be using grafana-toolkit.
grafana-toolkit is a CLI application that simplifies Grafana plugin development, so that you can focus on code. The toolkit takes care of building and testing for you.
-
In the plugin directory, create a plugin from template using the command:
-
Change directory.
-
Download necessary dependencies:
-
Build the plugin:
-
Restart the Grafana server for Grafana to discover your plugin.
-
Open Grafana and go to Configuration -> Plugins. Make sure that your plugin is there.
By default, Grafana logs whenever it discovers a plugin:
The General Idea
Lets say that you want to monitor a bunch of servers, and you want to keep track of multiple stats for each of them, and see in a glance the status of all of them.
This plugin will make it easier to do. You just add all the metrics you want to track, and choose how you want their values to be treated:
- Component severity marker — Set the threshold for each and you get an overview that will report to you if there is anything wrong with any of the metrics. This means that if all the metrics are in the OK state, the panel will be green. If even one of the metrics is in the WARNING state, it will be yellow, and red if any of them is CRITICAL.
- Component disable marker — Set the exact value that represents if the component is disabled, the panel will be grey.
- Display as text — show extra information about the component in the panel.
Severity and text values can be shown in 2 modes:
- Regular — under the panel title.
- Annotation — In the top left side of the panel.
Note: The disable markers are prioritized over the severity ones.
You can also repeat the panel on a template if you have multiple instances that you want to watch.
Настройка Grafana уведомлений
Для начала, устанавливаем почтовый сервер, я описывал все это дело в своей статье:
Если имеется почтовый сервер, то нужно немного настроить конфиг графаны:
# vim /etc/grafana/grafana.ini
И приводим к виду:
enabled = true
host = localhost:25
cert_file =
key_file =
skip_verify = true
from_address = admin@localhost
from_name = Grafana
Конечно же, перезапускаем сервер:
# service grafana-server restart
А сейчас, открываем графана:
Alerting -> Configure notifications -> New Channel -> Заполняем данные и пробуем отправить тестовое сообщение на почту.
Вот и все. Статья «Настройка Grafana с Graphite/Zabbix/Prometheus/MySQL/InfluxDB/Elasticsearch/CloudWatch для сбора и отображения метрик в Unix/Linux» завершена.
[3.4.0] — 2017-05-17
Added
- Alerting: highlight panel contained metrics with fired triggers.
- Alerting: add thresholds to panels from zabbix triggers.
- Docs: add docs for setAliasByRegex() from @v-zhuravlev
- Support millisecond resolution on graphs. Patch from Jay Dawes ajaxous@gmail.com.
- Sum and count aggregations.
- Expand user macros in items #212
- replaceAlias() function #287
- Additional config option for trends #364
Changed
- Add template variables to dropdown metric list #310
- Add all value regex to host dropdown.
- Replace native map() and forEach() methods by lodash.
Fixed
- Templatig issue when no values returned #354
- Add host name for multiple text metrics.
- Timeshift issue (Datapoints outside time range) for multiple targets with timeshift(), #338
Release Notes
Upgrading Tips
When upgrading there might be some changes in the data the plugin uses and saves, so some of the configurations you made might be removed by accident.
To prevent this loss of configuration you should save the panel JSON of all panels you have (by exporting the panel or dashboards) and keep them somewhere safe until you made sure everything is working after the upgrade.
Version 1.0.8 — What’s new?
- Adding support for Grafana 5.0.x:
- Added option to auto scroll the alerts in case the text overflows the panel view
- Fix header padding when title is absent
See the LICENSE file for license rights and limitations (Apache License, Version 2.0)
Grafana integration
Installation
Installing Grafana is simple. You can either download it from the official page or run it in the cloud.

Today I am going to explain how to configure Grafana on your machine, so I choose the download option. Grafana can run on Linux, Mac, Windows, etc., so simply select the right installation option for the platform you use and follow the instructions.
Getting started
Grafana, just like the Zabbix front end, is a web-based utility running on the local web engine. So once Grafana starts running with the default settings, we can go back to the browser to open the login page:
http://localhost:3000
Note. 3000 is the default HTTP port that Grafana listens to.
The default user credentials are admin/admin. When you log in for the first time you will be asked to change your password.
Once we are inside the Grafana home dashboard, we first need to add a data source before we can proceed with our first dashboard.
In Configuration > Data Sources you can choose from a variety of data sources from which to pull in the data and visualize it inside Grafana. What we need is a data source plugin to work through Zabbix API. Search the web for the official Zabbix plugin for Grafana by Alexander Zobnin or go to Configuration > Plugins > Zabbix.
Click on the Installation tab for instructions.
First, use grafana-cli, which is already available on your virtual machine after the installation of the Grafana server:
grafana-cli plugins install alexanderzobnin-zabbix-app
The plugin will be installed.

Then you need to restart the Grafana server for the changes to take effect:
systemctl restart grafana-server
Also, refresh the data source page. Go to Configuration > Plugins to enable our newly installed Zabbix data source:
With the plugin installed, we can log in to Grafana and configure it to talk to Zabbix.
Adding a data source
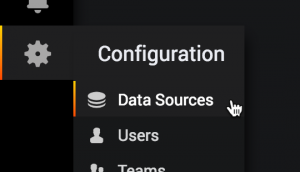
- Click on the cog on the side menu and go to Data Sources.
- Click Add data source.
- Select Zabbix.
- Check Default so this data source will be preselected in new dashboards.
- Enter URL:
127.0.0.1/zabbix/api_jsonrpc.php
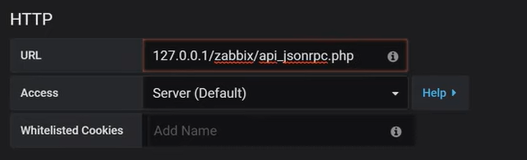
5. Set Access to ‘Server (Default)‘.
6. Specify your username and password in Zabbix API details.
7. Press Save & Test.
Creating a dashboard
Now we are going to create our first dashboard by pressing the plus on the sidebar and clicking Create > Dashboards.
Inside the dashboard, you can choose from a variety of panels.
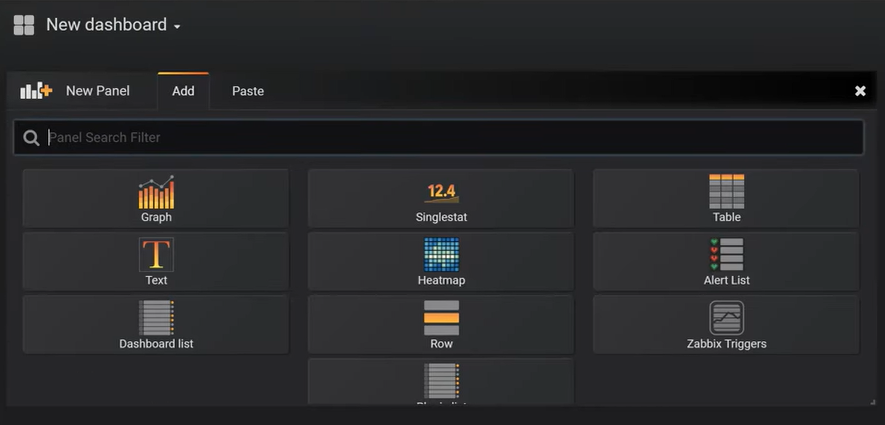
Let’s say we need a graph. New graphs can be added by clicking on the icon and going to Panel Title > Edit.
Configure the metrics like this, then save the dashboard:
To add another graph, simply repeat the previous steps. Existing graphs can also be duplicated or removed via Panel Title. You can drag-and-drop panels by clicking and holding the panel title and dragging it to a new location.
Other panel types can be configured similarly, for example, singlestat panels. You can use value mapping for singlestat panels to translate the value of the summary stat into explicit text.

Note. The value-to-text mapping function helps to translate the number of the main singlestat value into a context-specific user-readable text.
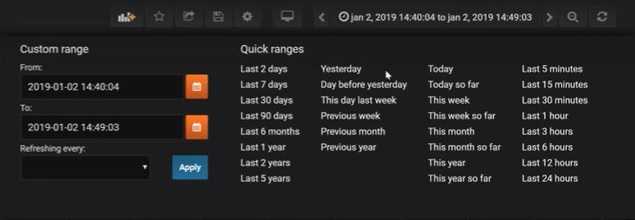
We can also change the time range to make our panels more illustrative at the dashboard level and the panel level. For example, I change the time range to ‘Today‘:
Настройка https
После установки Grafana работает по протоколу http. Для настройки https необходимо выполнить 2 задачи:
- Получение сертификата.
- Настройка графаны.
Получаем сертификат
Для получение сертификата можно его купить или запросить бесплатно у Let’s Encrypt.
Предположим, что мы получили сертификат от Let’s Encrypt для узла grafana.dmosk.ru и поместили его в каталог /etc/letsencrypt/live/grafana.dmosk.ru.
Настройка сервера Grafana
Открываем на редактирование конфигурационный файл:
vi /usr/share/grafana/conf/defaults.ini
Редактируем следующие опции:
…
protocol = https
…
cert_file = /etc/letsencrypt/live/grafana.dmosk.ru/fullchain.pem
cert_key = /etc/letsencrypt/live/grafana.dmosk.ru/privkey.pem
…
* где protocol определяет протокол, по которому будет работать веб-интерфейс grafana; cert_file — путь до открытого ключа безопасности; cert_key — до закрытого.
Перезапускаем сервис:
systemctl restart grafana-server
Пробуем перейти на веб-интерфейс графаны по доменному имени. В нашем примере, https://grafana.dmosk.ru:3000.
Установка Grafana в CentOS
В CentOS программа устанавливается похожим образом. Только добавление репозитория будет выглядеть совсем по-другому. Для добавления официального репозитория продукта создайте файл /etc/yum.repos.d/grafana.repo со следующим содержимым:
name=grafana baseurl=https://packagecloud.io/grafana/stable/el/7/$basearch repo_gpgcheck=1 enabled=1 gpgcheck=1 gpgkey=https://packagecloud.io/gpg.key https://grafanarel.s3.amazonaws.com/RPM-GPG-KEY-grafana sslverify=1 sslcacert=/etc/pki/tls/certs/ca-bundle.crt
Сохраните изменения с помощью :w, и можно устанавливать Grafana:
Затем, таким же образом, запустите сервис и добавьте его в автозагрузку:
systemctl start grafana-server systemctl enable grafana-server
Для управления брандмауэром в CentOS используется команда firewalld. Чтобы разрешить доступ к программе извне, выполните:
firewall-cmd —add-port=3000/tcp —permanent firewall-cmd —reload
Grafana готова к использованию.
Step 1 — Installing Grafana
Before we can use Grafana, we need to install it. We’ll use the same server we used for the Zabbix server. Log in to your Zabbix server with your non-root user:
Grafana isn’t available through the package manager by default, so we will set up the repository configuration file. First, create a new repository file for Grafana:
Paste the following configuration data into the file:
/etc/yum.repos.d/grafana.repo
Then save and exit the text editor and run the following command to install Grafana:
During the installation process you will be asked to import a GPG key. Confirm that you wish to import this key so the installation can continue.
Once the installation completes, start the Grafana service:
Then check whether the Grafana service is running properly:
You will see the following status:
Finally, enable the service to start at boot time:
Grafana is running, so let’s install the component that lets Grafana pull data from Zabbix.
Пример некоторых дашбордов
Я как-то заморочился и сделал обзорный дашборд в Grafana для Linux сервера. Работает с последними версиями стандартного шаблона Zabbix, который появился начиная с версии 4.4. Сам дашборд графаны переведен на русский язык, а шаблон Zabbix стандартный — английский. Получилось вот так:
За основу взял какой-то готовый дашборд, уже не помню где. Но сильно его переделал, так как он был под старую версию шаблонов заббикса. Сверху в выпадающем списке можно выбирать различные Data sources и сервера. Один дашборд для всех. В Zabbix такое сделать пока невозможно. Нужно потратить огромное количество времени, чтобы попытаться воспроизвести что-то подобное. Скачать панель можно отсюда — Zabbix-Server.json.
Вот еще один пример моего дашбода. Тут сводная информация по моим сайтам и группам, плюс доход в adsense.
Беглого взгляда на этот дашборд достаточно, чтобы оценить обстановку и не тратить время на ручную проверку всех этих метрик.
А это сводная картинка активных триггеров с нескольких серверов мониторинга.
Я показал несколько общих дашбордов, которые регулярно использую в Grafana. Остальное делается по месту разным заказчикам в случае необходимости. Все в связке с Zabbix. Отдельно графану или в связке с чем-то еще я не использую.
Set up your environment
Before you can get started building plugins, you need to set up your environment for plugin development.
To discover plugins, Grafana scans a plugin directory, the location of which depends on your operating system.
-
Create a directory called in your preferred workspace.
-
Find the property in the Grafana configuration file and set the property to the path of your directory. Refer to the for more information.
-
Restart Grafana if it’s already running, to load the new configuration.
Alternative method: Docker
If you don’t want to install Grafana on your local machine, you can use Docker.
To set up Grafana for plugin development using Docker, run the following command:
Since Grafana only loads plugins on start-up, you need to restart the container whenever you add or remove a plugin.
Термины Grafana
- Панель — базовый элемент визуализации выбранных показателей. Grafana поддерживает панели с графиками, единичными статусами, таблицами, тепловыми картами кликов и произвольным текстом, а также интеграцию с официальными и созданными сообществом плагинами (например, карта мира или часы) и приложениями, которые также можно визуализировать. Можно настроить стиль и формат каждой панели; все панели можно перетаскивать на новое место, перестраивать и изменять их размер.
- Дашборд — набор отдельных панелей, размещенных в сетке с набором переменных (например, имя сервера, приложения и датчика). Изменяя переменные, можно переключать данные, отображаемые на дашборде (например, данные с двух отдельных серверов). Все дашборды можно настраивать, а также секционировать и фрагментировать представленные в них данные в соответствии с потребностями пользователя. В проекте Grafana участвует большое сообщество разработчиков кода и пользователей, поэтому существует большой выбор готовых дашбордов для разных типов данных и источников.
- В дашбордах можно использовать аннотации для отображения определенных событий на разных панелях. Аннотации добавляются настраиваемыми запросами в Elasticsearch; на графике аннотация отображается вертикальной красной линией. При наведении курсора на аннотацию можно получить описание события и теги, например, для отслеживания ответа сервера с кодом ошибки 5xx или перезапуска системы. Благодаря этому можно легко сопоставить время, конкретное событие и его последствия в приложении и исследовать поведение системы.
Установка Grafana
Установить Grafana не просто, а очень просто. Я вообще не стал заморачиваться, так как мне она нужна только для одного дашборда. Поэтому запустил графану в докере.
Запустил Grafana на 3000 порту, сразу же установив несколько основных плагинов, в том числе тот, что нужен для интеграции с zabbix — alexanderzobnin-zabbix-app.
Если не хотите docker, то воспользуйтесь документацией по установке. Там нет никаких проблем, так как есть репозиторий с готовыми пакетами. Ставится все очень быстро и просто.
Я настроил доступ к web интерфейсу Grafana через nginx proxy_pass с помощью следующего конфига. Предварительно получил сертификат let’s encrypt.
Дальше можно идти в web интерфейс и логиниться. Логин и пароль по умолчанию в Grafana — admin / admin.


